SiC (jpg)
File size: 248 kB
Language: Language Independent
Dimensions: 760 x 220 px
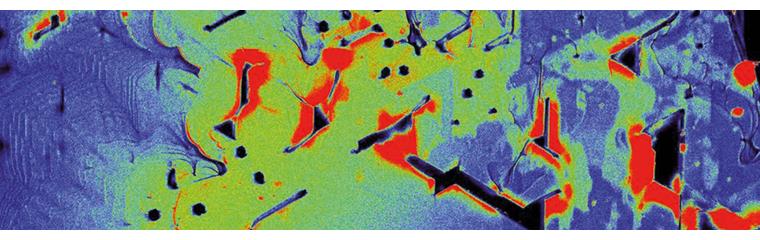
Raman image of SiC-4H epilayer highlighting areas of non-uniformity. Red regions represent inclusions of SiC-6H, Sic-3C or Si. Black regions are voids. This technique also allows the strain in the layer to be visualised qualitatively (green and blue). 8 million spectra, ~900 µm (0.3 µm step size), <12 hours (5 ms/spectrum)
Latest videos - Raman spectroscopy


Didn't find what you were looking for?
Tell us what you couldn’t find and we will do our best to help.