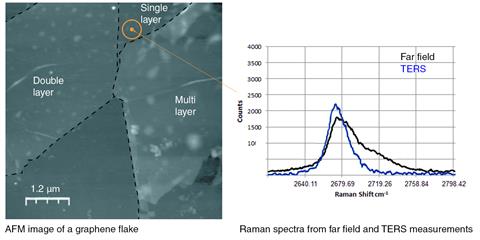
AFM image of a graphene flake with Raman spectra from far-field and TERS measurements. (jpg)
AFM image of a graphene flake with Raman spectra from far-field and TERS measurements. The circle represents the size of the laser spot, from which a far-field Raman spectrum was acquired (black). The smaller dot represents the location of the TERS hot-spot on the graphene (~ 20 nm diameter), from which a TERS spectrum was derived (blue). The carbon 2D band of the far-field spectrum (black) exhibits features of single-, double-, and multi-layer graphene. The band in the TERS spectrum (blue) is narrower than that of the far-field spectrum, and represents solely single-layer graphene. This demonstrates the high spatial resolution of TERS.
Non è stato possibile trovare quanto cercato?
Informaci di quanto non è stato possibile trovare e faremo del nostro meglio per risolvere il problema


