Ballbar testing explained
The popularity of ballbar testing for machine tool accuracy has been built on the simplicity of the test, speed of use and the large amount of quantitative data generated.
How does the ballbar test work?
In theory, if a CNC machine to instructed to trace a circular path and its positioning performance of the machine is perfect, the resulting circle would precisely match the programmed circle. However, in practice, various factors can lead to deviations in both the radius and shape of the test circle when compared to the programmed circle. These factors include machine geometry, intricacies in the control system, and wear and tear of the machine over time.
By carefully measuring and comparing the actual circular path to the one programmed, you can determine the machine's accuracy. This is the basis of telescopic ballbar testing and how the QC20 ballbar works.
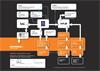
Three simple stages of QC20 ballbar testing
Set-up
Connecting the QC20 ballbar is simple, thanks to its Bluetooth connectivity. Test set-up is quick and easy with Ballbar 20 software guiding the operator through each step. The 'part programme generator' will helps set up the corresponding programme on the machine tool.
The powerful file administration feature can search and access existing test templates.
The centre pivot is positioned on the machine table, using the setting ball provided with the QC20 ballbar. The spindle is moved to a reference point; and the test 'zero' coordinates are set.
The spindle is moved to the test start position and the QC20 ballbar is mounted between two kinematic magnetic joints. A simple G02 and G03 command program is all that is required to start the test.
Data capture
The 'standard' test calls for the machine tool to perform two consecutive circles; one in a clockwise direction, the other counter-clockwise. In practice there is an extra arc added before and after the test circle to allow for the machine speeding up and slowing down.
With the use of extension bars the test radius can be selected to reflect the size of the machine and the sensitivity to particular issues (e.g. large radius circles are better at highlighting machine geometry errors, smaller circles are more sensitive to servo mismatch or lag).
Real-time data capture helps to detect errors or problems as the test progresses. The test can be stopped to avoid wasting time which is important if you are carrying out a large radius test with a slow feed rate.
Before the launch of QC20 ballbar, testing in planes perpendicular to the standard X-Y test plane meant using special test mounts and repositioning of the centre mount. Now you can carry out tests covering three orthogonal planes without moving the centre pivot.
The secret to this is the ability of the QC20 ballbar system to carry out a restricted arc (220°) in two of the planes. This produces a modified test analysis for that arc but still produces an overall circularity value for that test.
With all three tests carried out around a single point it allows the use of the volumetric diagnostics report in Ballbar 20 software. This gives more information and is quicker than with previous systems.
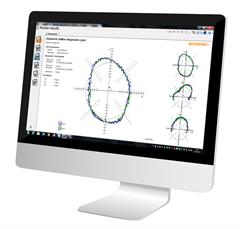
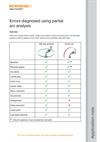
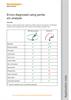
Data analysis and diagnosis
A selection of report formats are available to International standards (e.g. ISO, ASME). The comprehensive Renishaw diagnostics (with volumetric analysis) include a series of different screens views and links to the help manual.
These reports give a value for a single overall indicator of machine positioning performance, e.g. circular deviation.
The reports can be customised and deliver an in-depth diagnosis of machine errors; all from a single test.
The QC20 ballbar for machine tool verification is highly recommended within the industry and is leading the way in machine tool diagnostics.
Find out more
Download Ballbar 20
Enhanced software to give greater flexibility for testing and reporting.
Can I use QC20 ballbar to meet ISO 10791-6 standard?
Yes, when using QC20 ballbar most tests can be completed to meet the ISO 10791-6 standard.
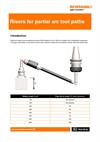
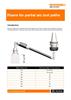
During multi-axis movements a machine tool is trying to maintain a fixed separation between the tool tip and the workpiece. A ballbar is able to measure the contouring performance by measuring any deviation between tool tip and workpiece, whilst following multi-axis tool paths.
The ISO 10791-6 standard requires reporting of the maximum to minimum deviation. This can easily be achieved by capturing data with Ballbar Trace software.


Contact our sales team today
Get in contact with your local office to find out more information and speak to an expert.