What Raman images can reveal
Raman images can show the distribution of chemical and structural species within a sample. Learn how to collect and analyse Raman images.
What Raman images can tell you
Using the spectral information in each pixel of a Raman image, we can determine:
- if a material or species is present
- if any unknown materials are present
- the distribution of the material or species
- the size of any particles or domains
- the relative amounts of materials or species
- the structural variation in a material, such as crystallinity or stress state
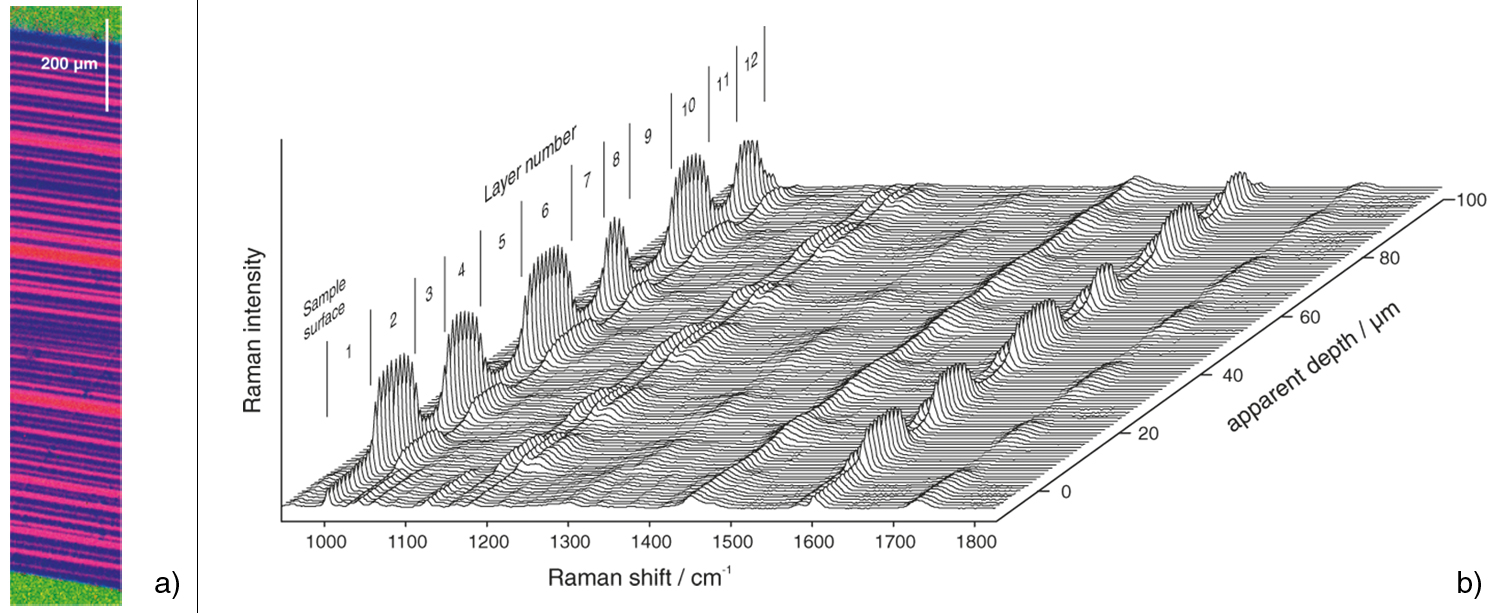
- the thickness and composition of layered materials, such as polymer laminates, from micrometres to millimetres thick
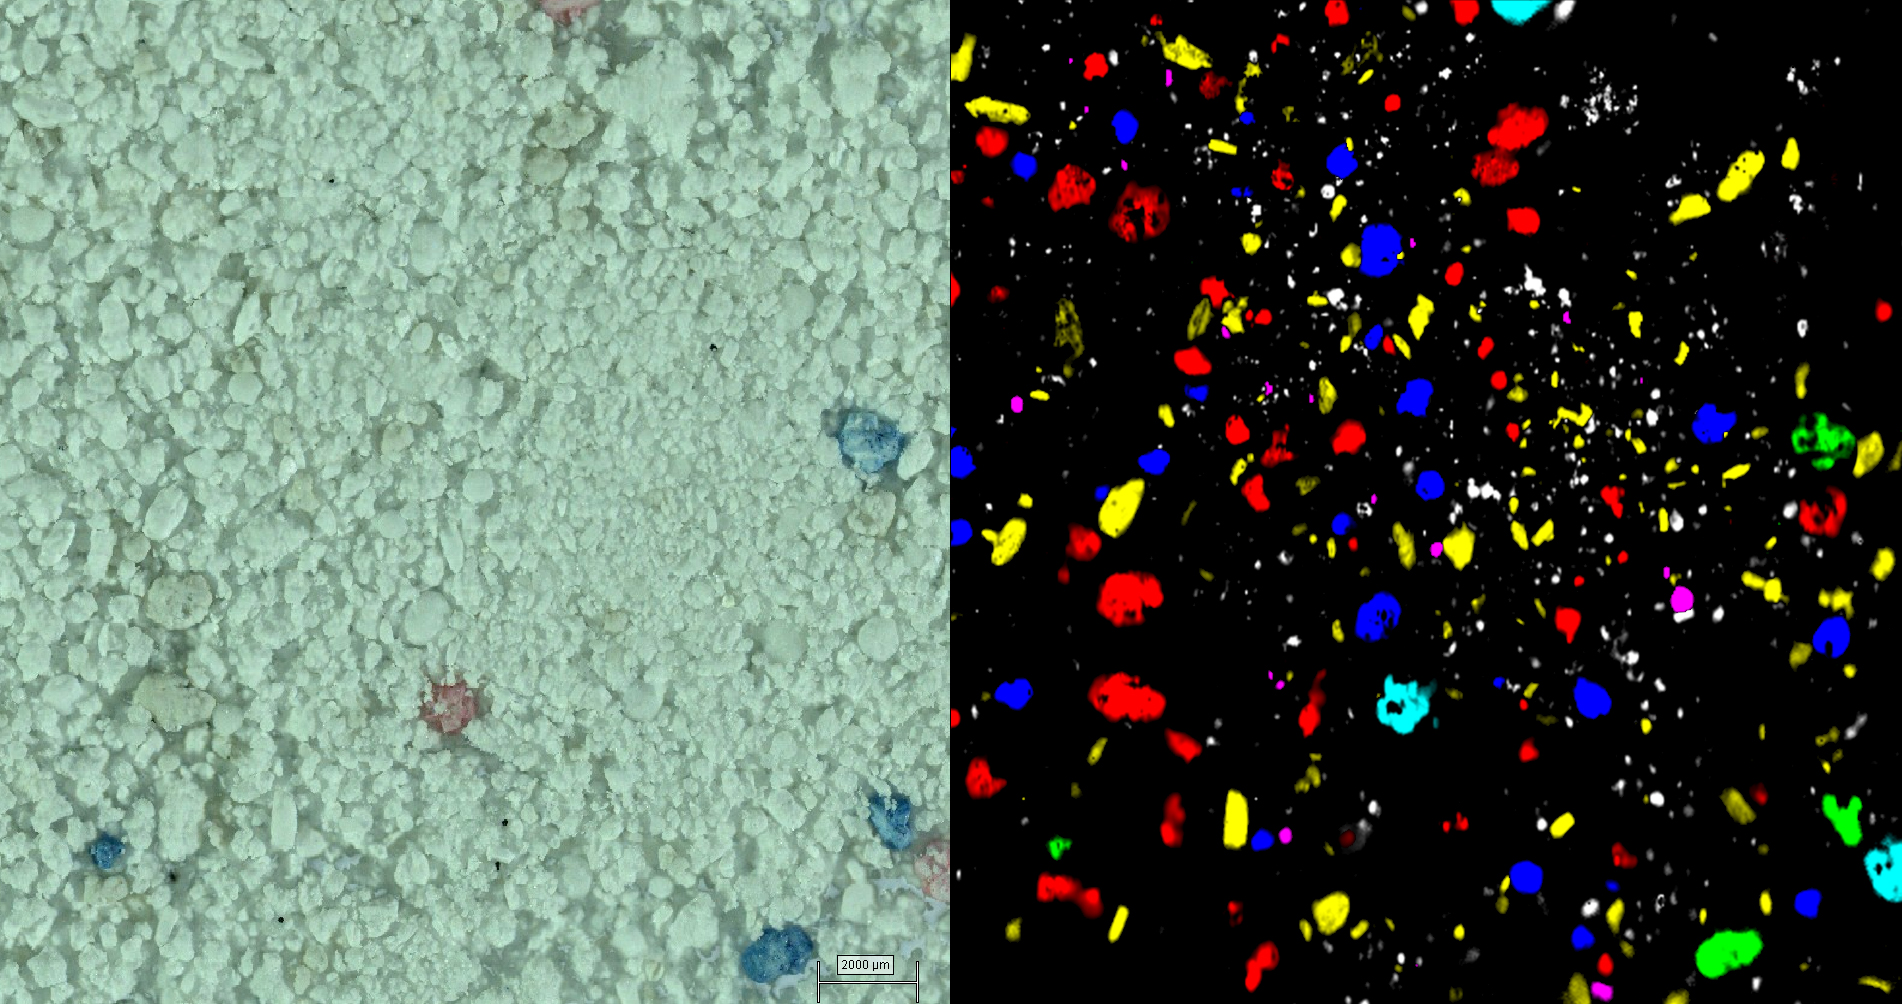
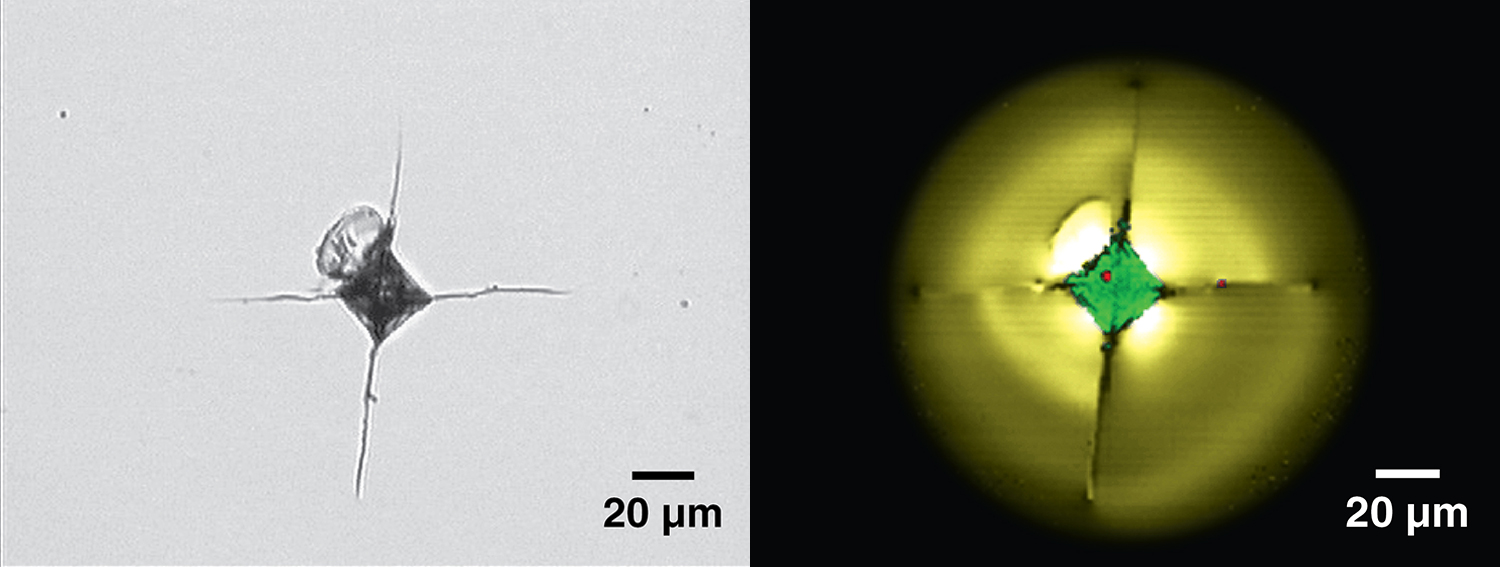
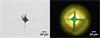
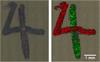
White light and Raman images of washing powder. The Raman images show chemically different domains which are not visible in the white light image.
Qualitative and quantitative Raman imaging
False colour Raman images are a powerful way to emphasize the distribution of chemical and structural properties within a sample. The brightness, contrast and colour of the image can help to represent material composition. By overlaying individual Raman images, you can display the distribution of multiple species or properties at the same time.
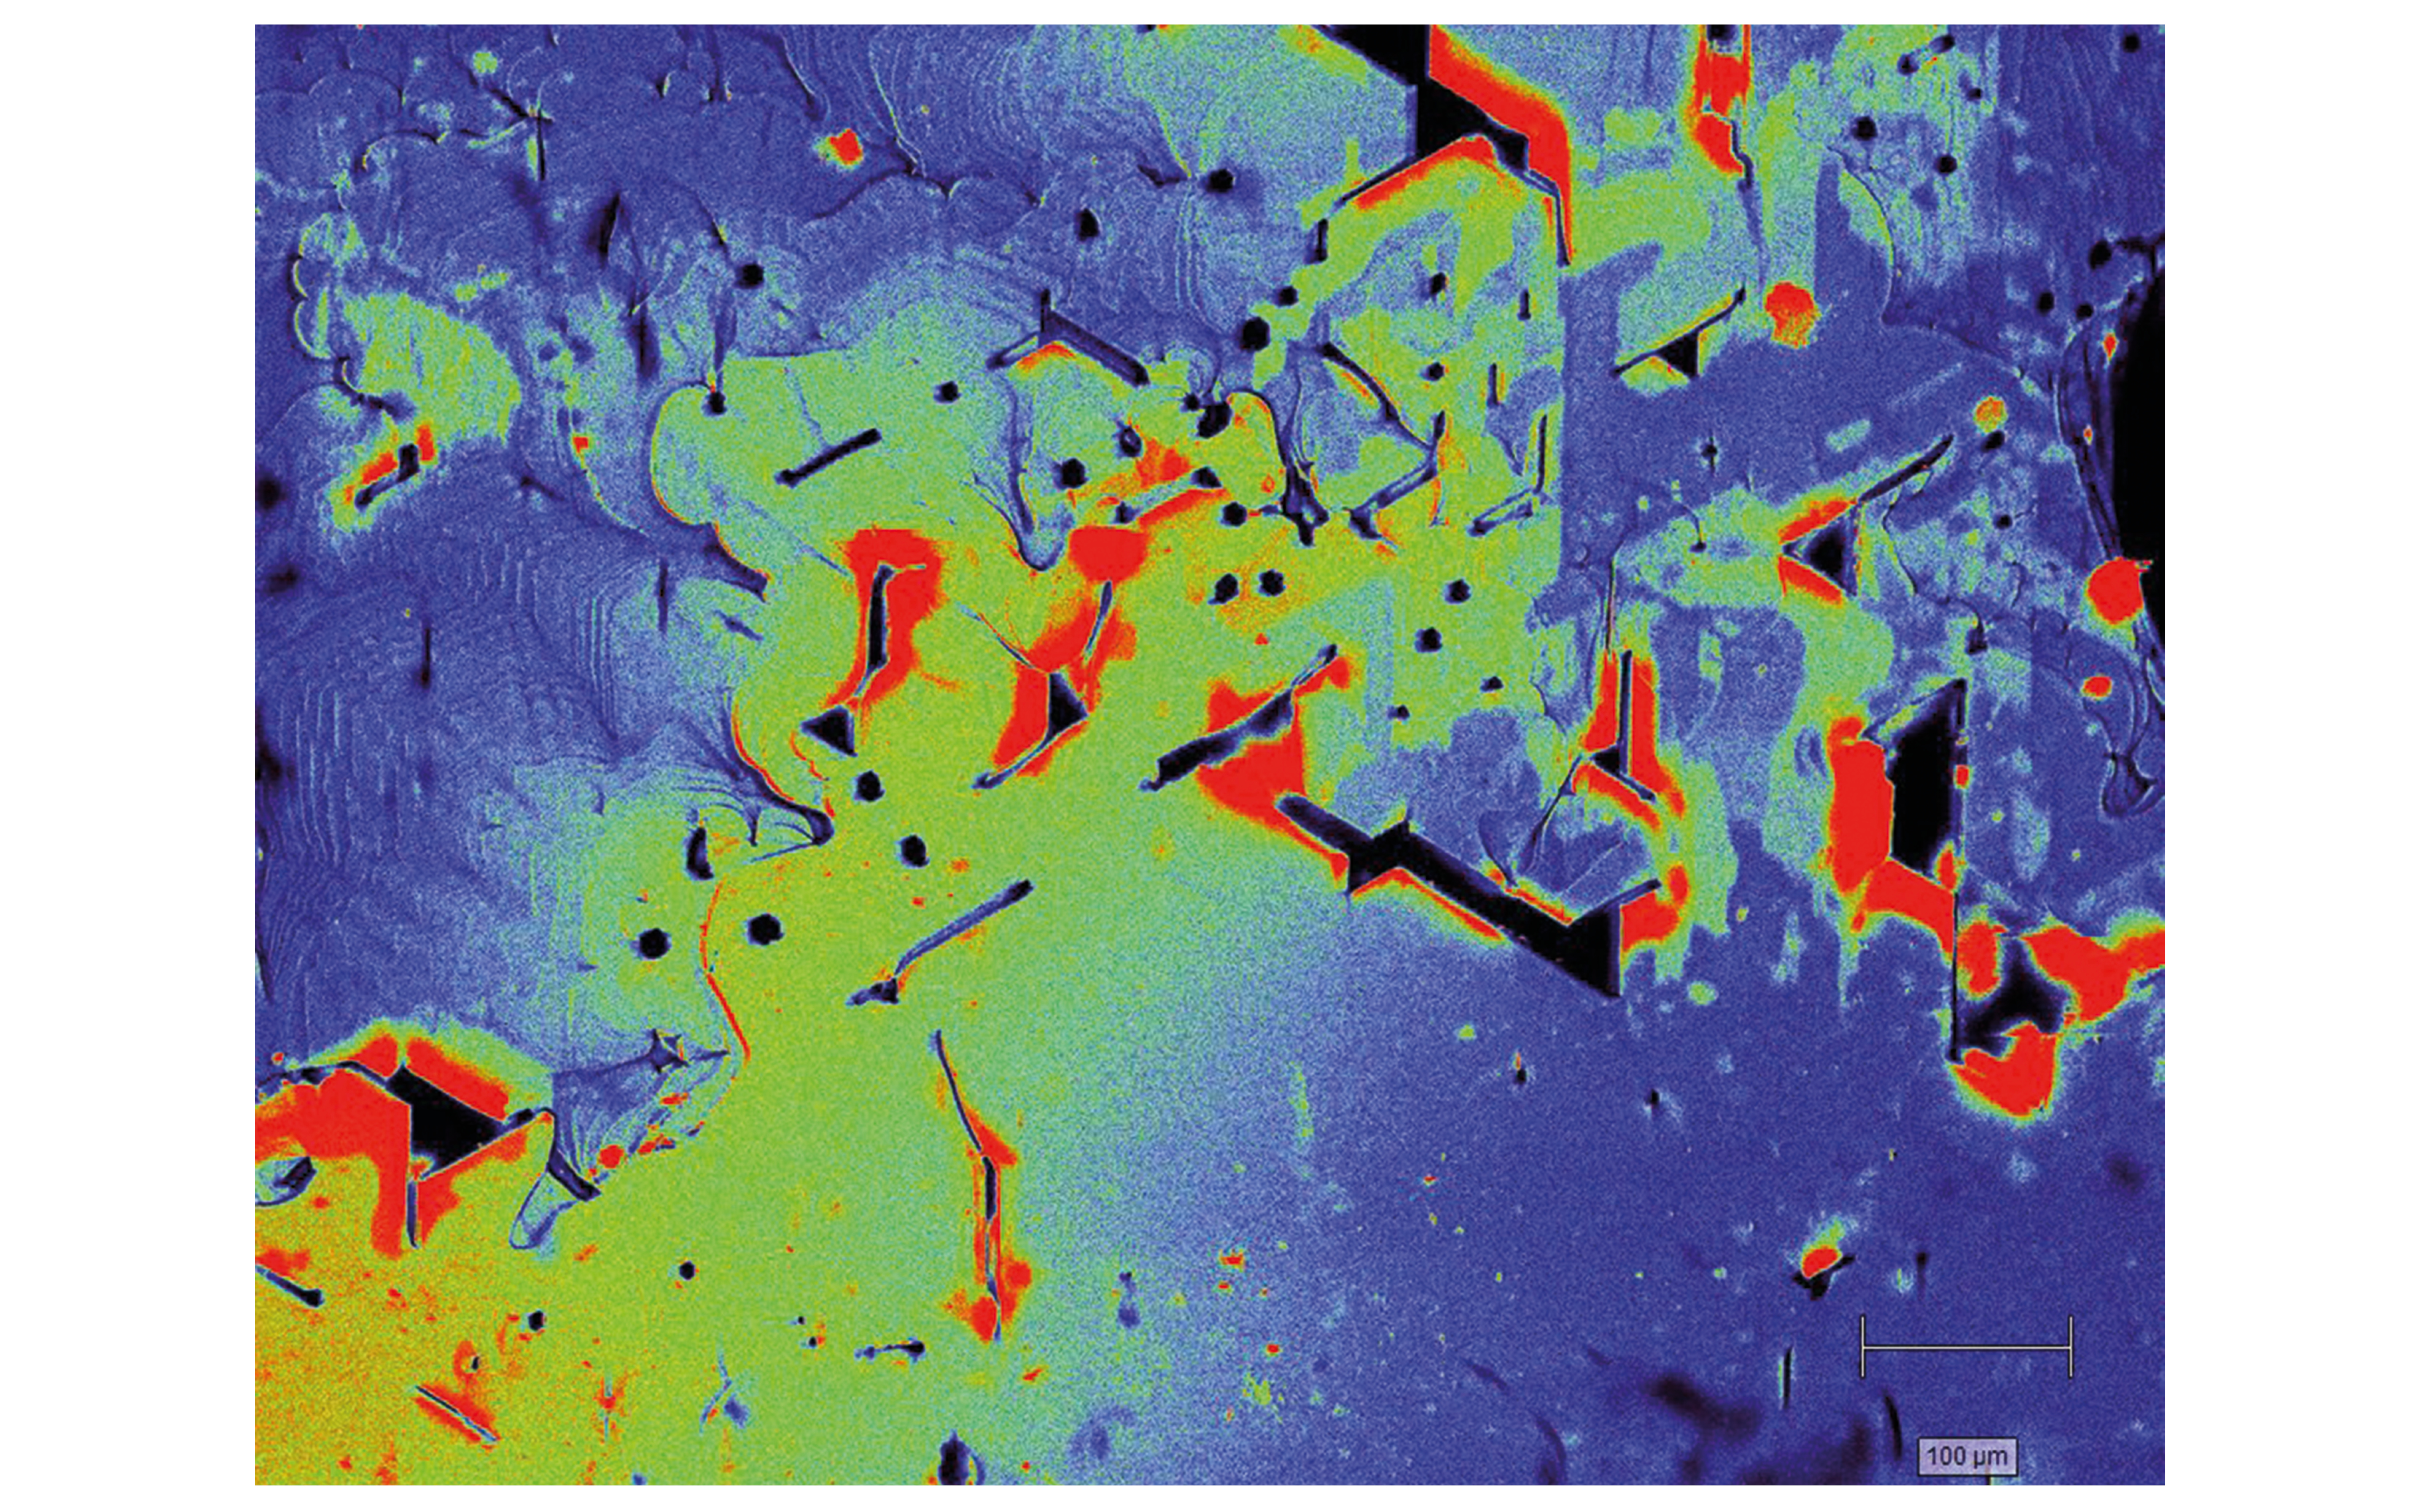
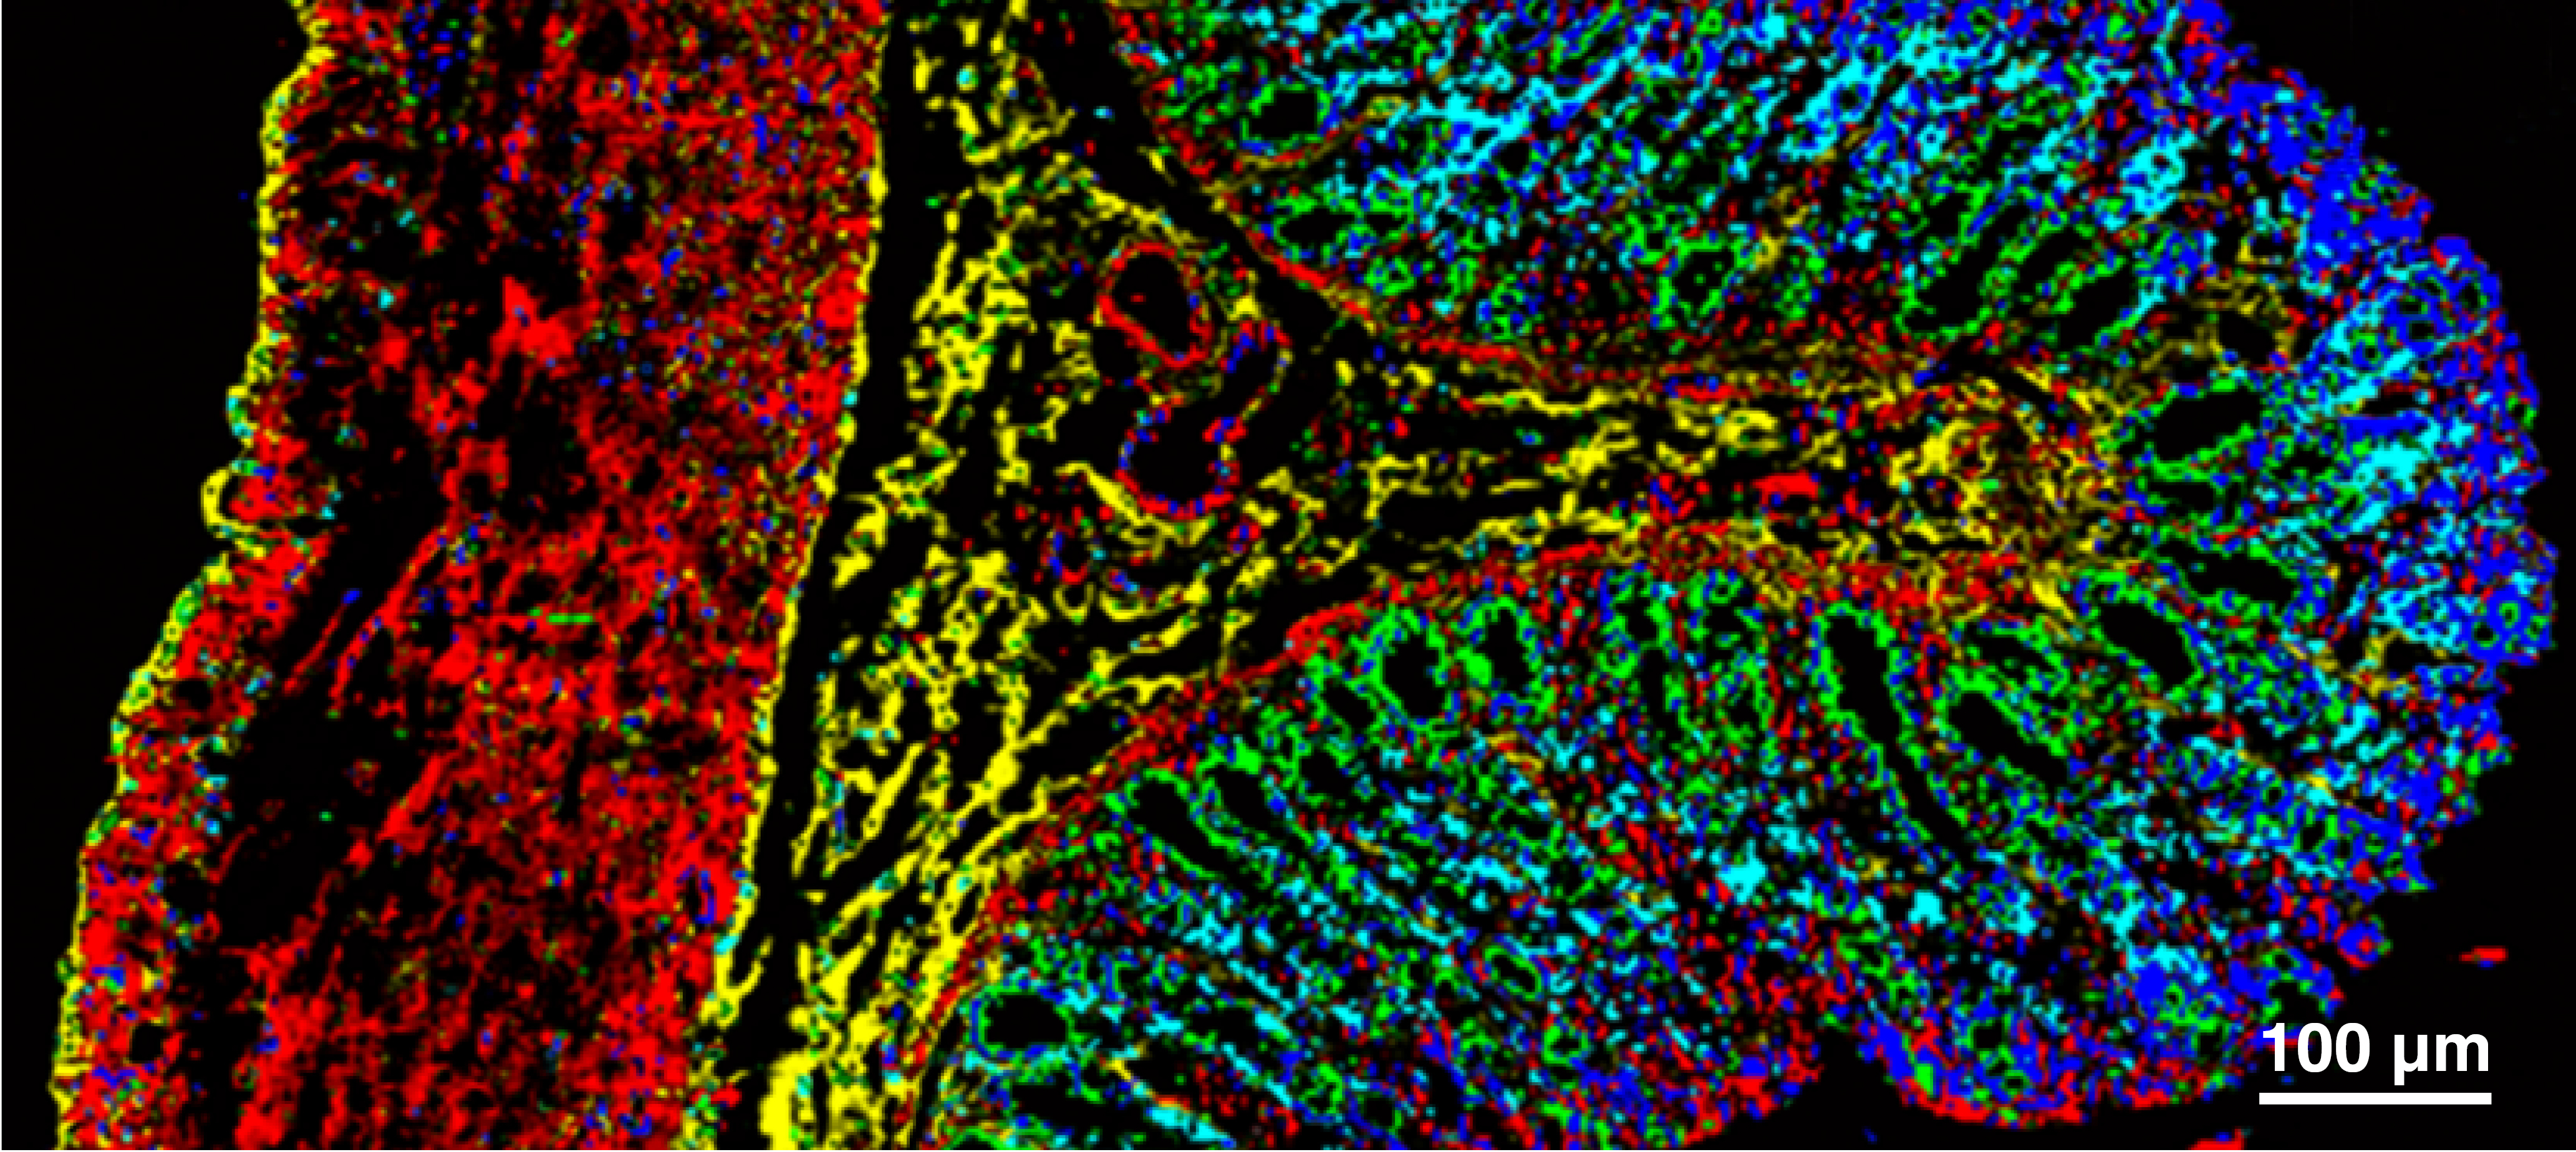
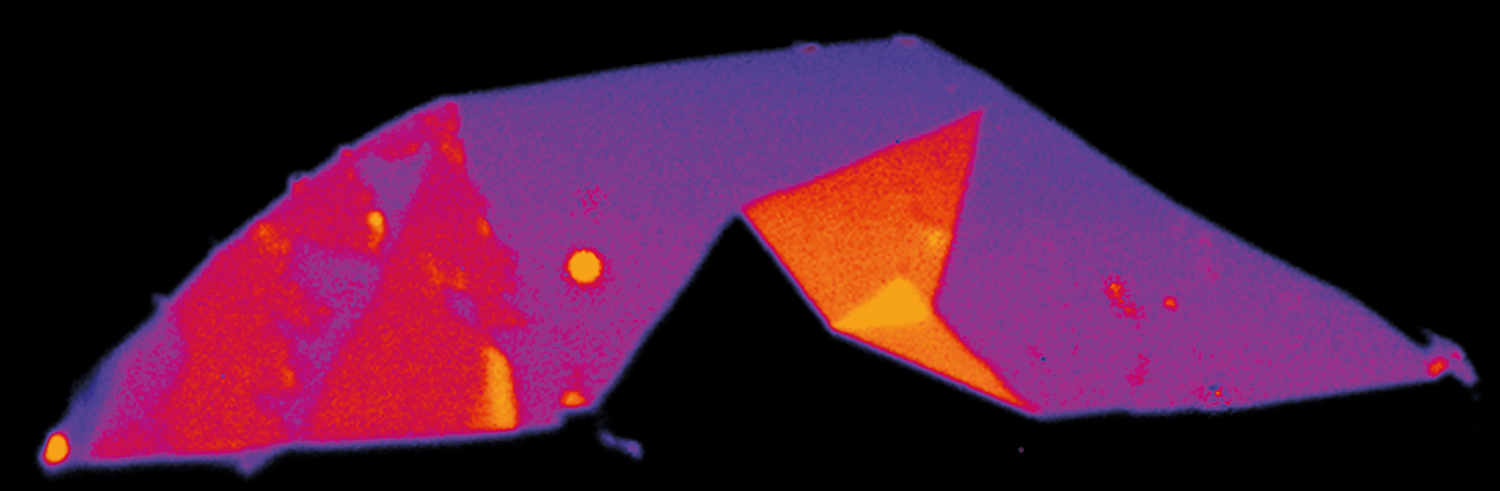
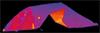
Raman image of a SiC wafer. The images area is approximately 1 mm2, and shows inclusions of 6H-Silicon carbide, 3C-Silicon carbide or Si (red), voids (black). The strain distribution is shown as blue to green.
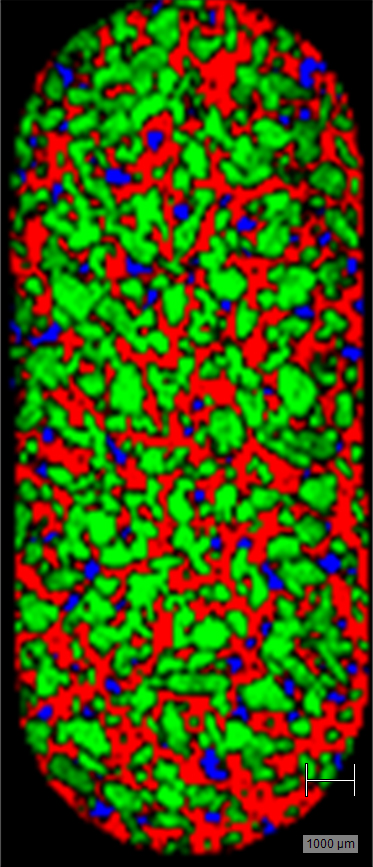
 Raman image of montelukast sodium API within an oral tablet. API domains are shown in different colours for easy visualisation.
How do we collect Raman images?
Using a Raman microscope, we collect Raman spectra from each position on the sample. We then save all the Raman spectra in a single data file, which we call a spectral hypercube. Finally, we can analyse the spectral hypercube to produce Raman images.
There are several Raman imaging methods, such as:
Point focus
The Raman microscope focuses the laser to a spot on the sample. We place the sample on a motorised stage that moves the sample under the laser. The spectrometer collects spectra from an array of points across the sample.
Fast versions of point-focus imaging are Renishaw's StreamHR™ and StreamHR™ Rapide imaging technologies. Raman imaging with StreamHR Rapide technology can acquire over 1,000 spectral points per second.
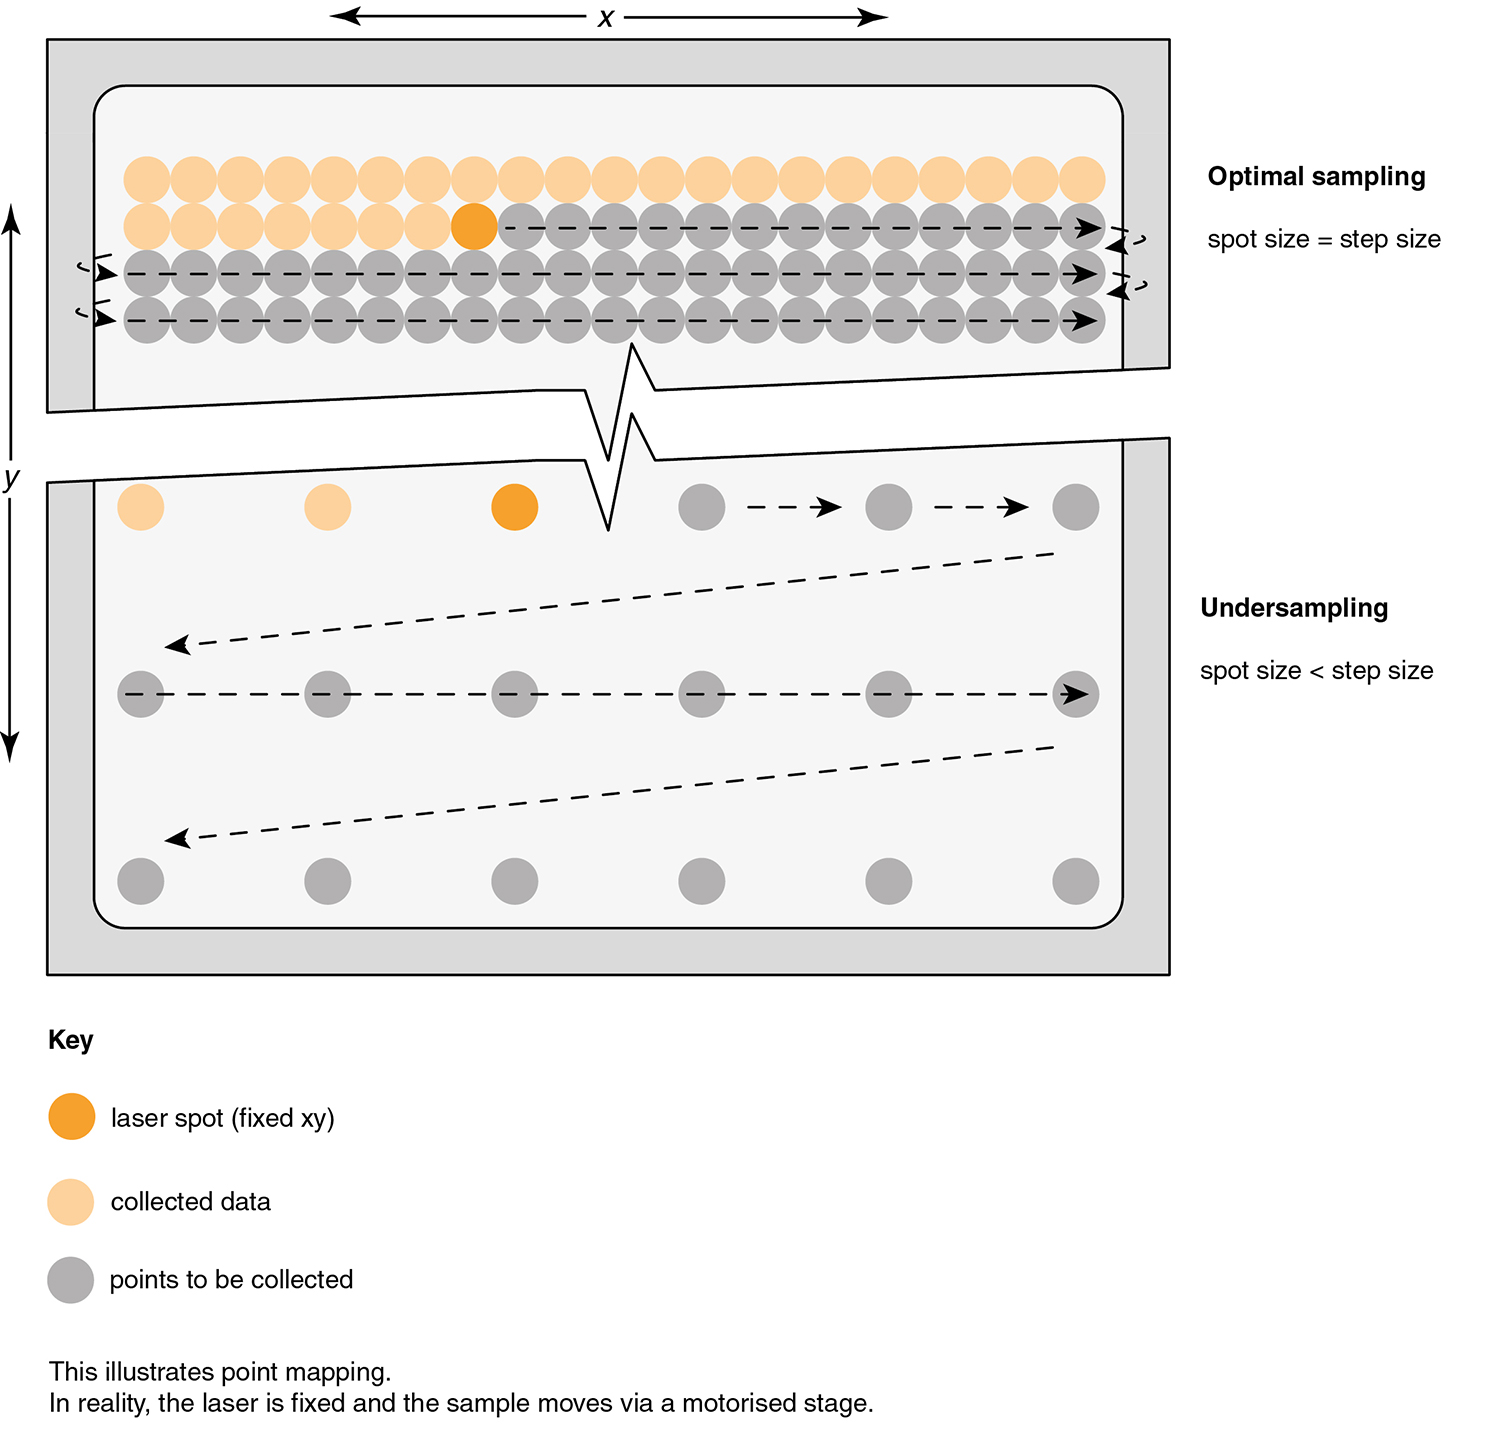
Diagram showing point-by-point imaging, depicting both optimal imaging and undersampling.
Line focus
The laser illuminates a line on the sample, rather than a spot. This enables you to simultaneously collect spectra from multiple positions on the sample, saving time. With this method you can use higher total laser powers without damaging the sample. Renishaw's StreamLine™ imaging technology is a sophisticated modern implementation of this concept. With line focus imaging, the laser illuminates a vertical line on the sample rather than a spot.
When imaging, it is important to consider the potentially undesirable effects of undersampling. Undersampling occurs if the laser spot or line is smaller than the spacing between acquisition points. Renishaw has solved this problem using StreamLine technology with Slalom mode.
Streamline™ imaging technology with Slalom mode ensures complete sample coverage, even when using large step (pixel) sizes. You can perform fast Raman imaging of large samples without missing anything.
StreamLine technology for fast yet gentle Raman imaging
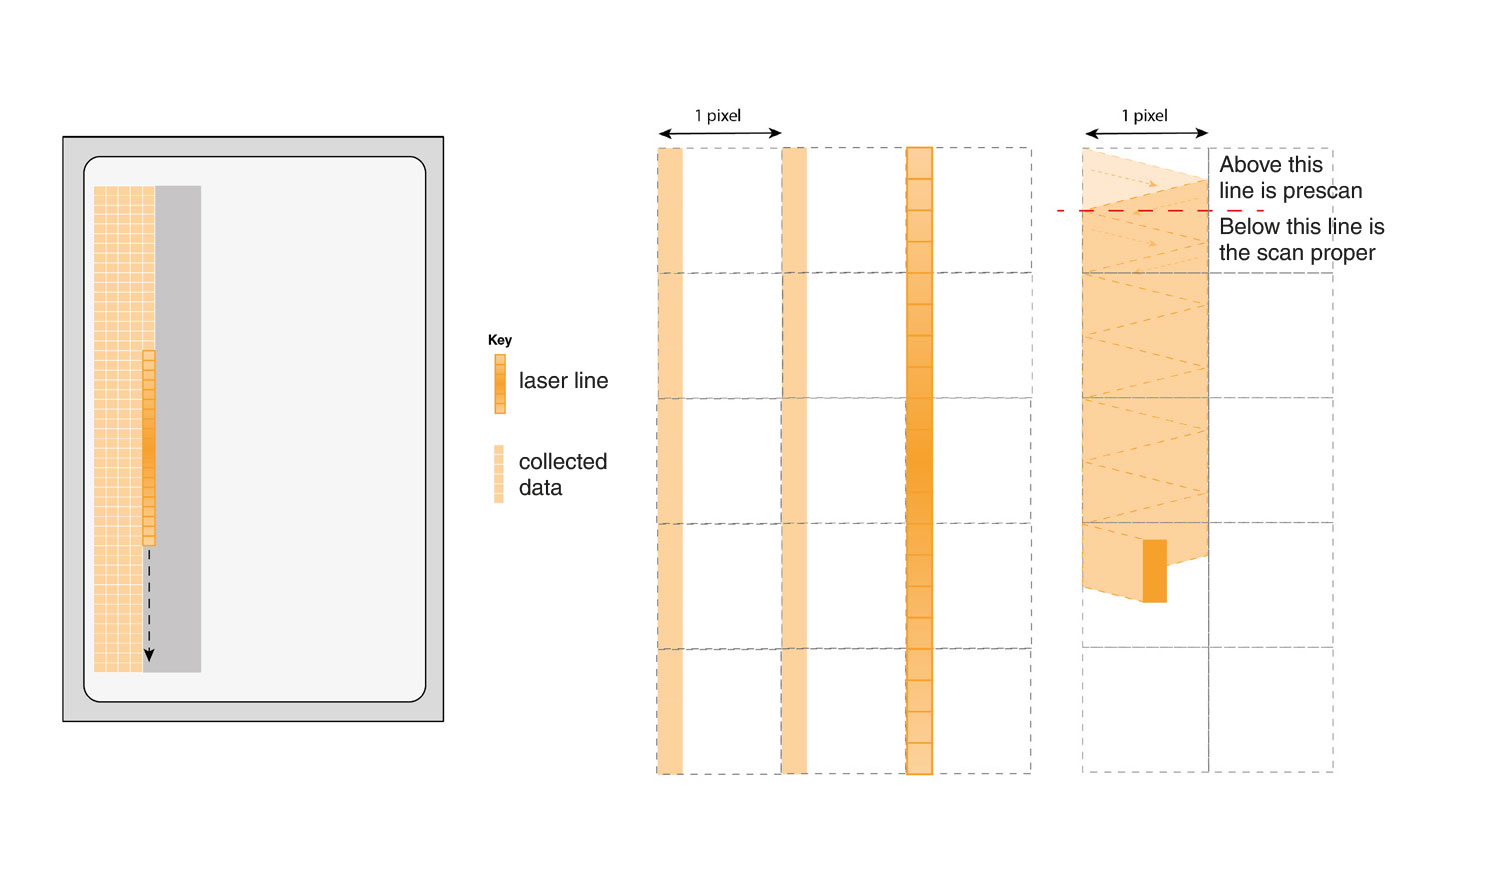
The system scans the laser line across the sample along the y-axis. The CCD detector simultaneously collects data from multiple points on the sample.
The step size in x is equal to the width of the laser line. This method results in complete coverage, but not at the fastest speeds.
Undersampling without Slalom mode
The step size in x is greater than the width of the laser line. The laser line does not scan between the pixels so the spectrometer will not analyse some areas of the sample. In this illustration, the system only collects data from ~20% of the sample.
Streamline technology with Slalom mode for fast and complete coverage
The zig-zag motion of the laser line scans sample areas that are between the pixels. This enables a step size in x that is greater than the width of the laser line.
The spectrometer now collects data from 100% of the sample at the fastest speeds.
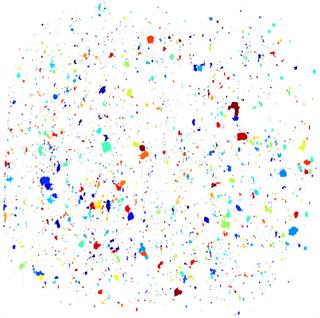
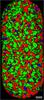
A Raman image shows the tissue organisation within a healthy rat colon crypt. PCA was used to create this image.
How can I analyse Raman images?
We can analyse Raman spectra from an imaging experiment to get 1D profiles, 2D images or 3D rendered volumes. The Raman image could show simple univariate band parameters such as the intensity of a Raman band. Alternatively, you could use a complete multivariate analysis of the whole Raman spectrum across the spectral hypercube.
Renishaw's WiRE™ software includes many data analysis options for Raman imaging:
Intensity at one frequency in the spectrum
These images are quick to generate but may be misleading. This method cannot differentiate between intensities arising from a Raman band of interest or those associated with a broad background fluorescence.
Curve fit parameters
For each spectrum in a Raman image, you can fit a theoretical curve for each Raman band. You can calculate Raman band parameters such as Raman shift, band width or relative intensity. Raman images often show variations in the Raman shift of a band, which can indicate localised stress. They can also show variations in the Raman band width, can indicate different degrees of crystallinity.
Multivariate parameters
Multivariate analysis is very powerful because it uses information from the entire spectrum, not just one Raman band parameter (e.g. intensity at one frequency or one curve-fitted band). This typically results in higher quality Raman images, with better chemical specificity.
If you have reference spectra for the chemical components within your sample, you can easily create Raman images showing their distribution. In such cases, you would use component analysis methods like direct classical least squares (DCLS) or non-negative least squares (NNLS). You can use these component analysis methods to get quantitative concentration estimates.
If no reference spectra are available, you can create Raman images using unsupervised chemometric methods. These include cluster analysis, principal component analysis (PCA), or Renishaw's EmptyModelling™ software feature. We can use these chemometric methods without knowing what is in the sample. These methods analyse the systematic variance between Raman spectra to predict spectral components. A Raman image then shows the distribution of spectral components across the sample.
We often use cluster analysis and PCA to analyse the Raman images of biological tissues and cells. These powerful chemometric methods can detect structures within biological samples which often contain no pure biochemicals.
The EmptyModelling feature is a user-friendly version of multivariate curve resolution-alternating least squares (MCR-ALS) analysis. This method can create Raman images of samples that identify unknown regions of pure components. This is important for samples like semiconductor wafers or pharmaceutical formulations.
These advanced data analysis features are all part of WiRE software's chemometrics package. You can use these methods straight away without doing any programming.
eBook download: Raman spectroscopy explained
- What is the Raman effect?
- What is Raman spectroscopy?
- What can Raman imaging show you?
- Advantages of Raman spectroscopy
- Parts of a Raman spectrometer
- Photoluminescence explained
Image gallery


What is Raman spectroscopy?
Continue your exploration of Raman and photoluminescence (PL) spectroscopy. We answer your questions on Raman microscopy, fast Raman imaging, data analysis, fluorescence and complementary analytical techniques.
Raman spectroscopy explained