현재 사용 중인 언어로는 이 페이지를 사용할 수 없습니다. Google Translate을 사용하여
자동 번역된 페이지
를 볼 수 있습니다. Renishaw에게는 이 서비스를 제공할 책임이 없으며 번역 결과를 저희가 확인하지도 않았습니다.
추가로 도움이 필요하시면
저희에게 연락해 주십시오.
Mapping of oral biofilms using confocal Raman microscopy
Microorganisms form biofilms on surfaces to aid their survival. Bacterial accumulation and biofilm formation in subgingival regions can cause gingivitis and other periodontal infections. Studying microbial composition and biofilm architecture can help us to understand oral disease mechanisms.
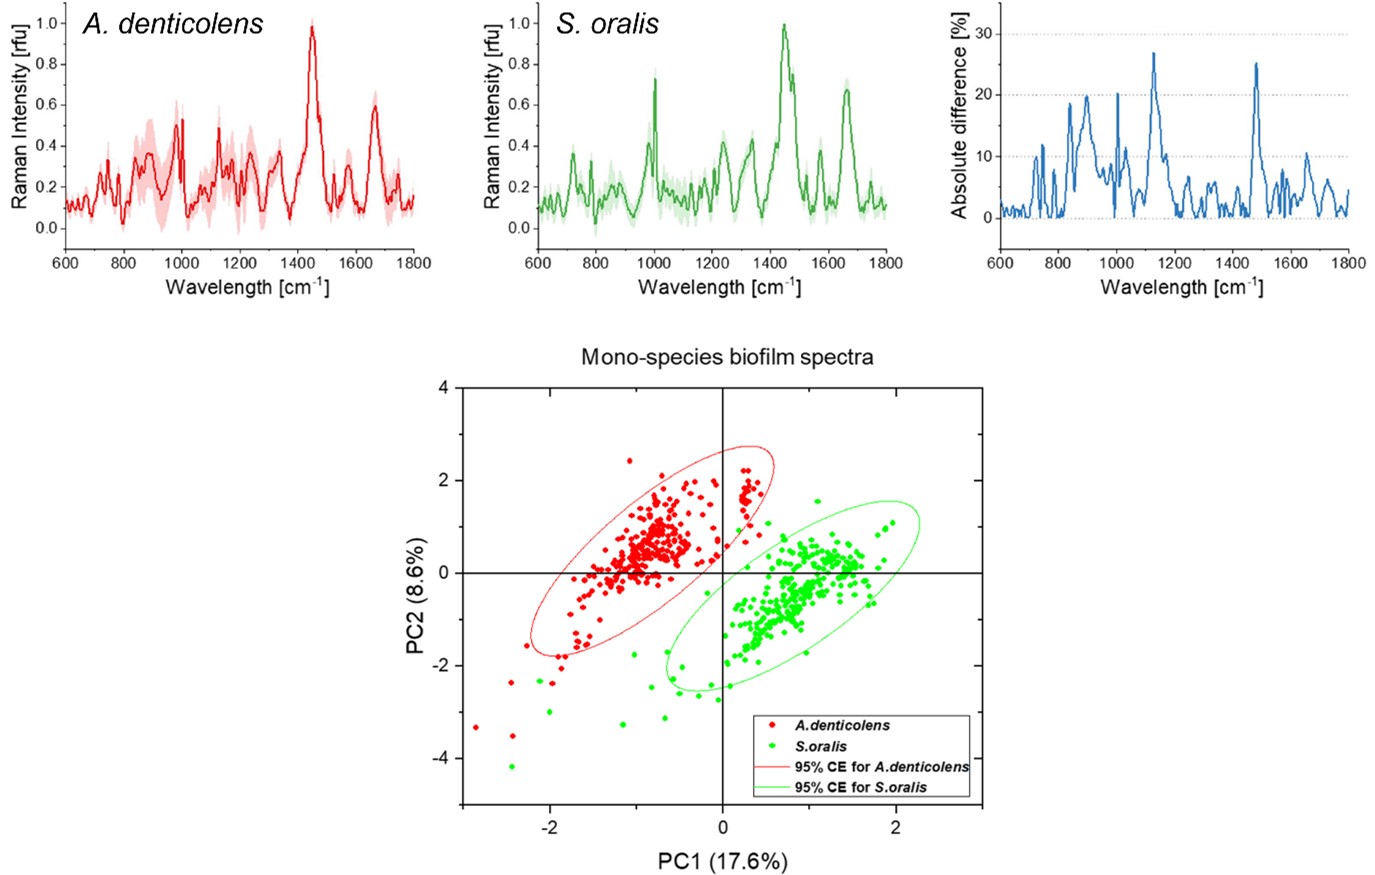
Using the Renishaw inViaTM Raman microscope, researchers at Procter & Gamble and the Fraunhofer Institute for Interfacial Engineering and Biotechnology have used confocal Raman microscopy and multivariate analysis to predict and separate two subgingival bacteria species in a biofilm model. Researchers collected spectra from two early colonising species of bacteria, Actinomyces denticolens and Streptococci oralis. They collected 300 spectra from a mono-species biofilm for each bacterial strain, which revealed differences in peak intensities between the species. They then applied a principal component analysis (PCA) to separate the two species into two distinct clusters.

Average Raman spectra for A. denticolens and S. oralis mono-species biofilms. Spectral differences are represented in the absolute difference spectrum. The PCA score plot shows separation of the two bacterial species.

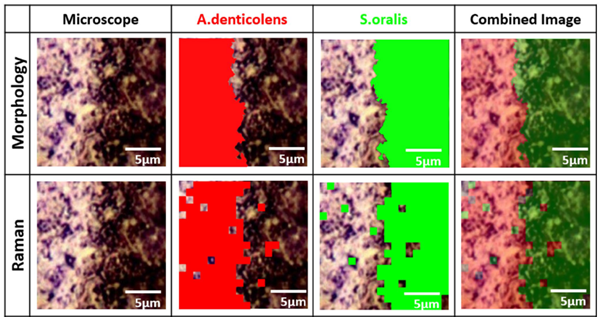
Analysis of A. denticolens and S. oralis distribution. Morphology analysis and Raman analysis were directly compared using the same sample region.
Having clearly separated the two bacterial species using PCA, the researchers next collected Raman maps from a sample containing A. denticolens and S. oralis. The two species of bacteria were grown adjacent to each other on a slide and the interface region between them was mapped using confocal Raman spectroscopy. Cluster analysis was used to identify and separate the bacteria, which produced a well-defined edge at the interface between the two species. For validation of Raman mapping, the researchers also performed a morphological analysis on the same sample regions. This technique separated the bacteria based on their shape (rod-shaped vs round). The morphology analysis revealed the same clearly defined boundary between the two bacterial species, hence validating the Raman analysis.
The researchers next analysed 15 random regions of an artificially grown bacterial biofilm using confocal Raman spectroscopy. They used cluster analysis to separate A. denticolens and S. oralis in each region and visualised the distribution of each species. They again validated the separation of the two bacterial species by comparing the Raman data with morphological analysis data. The images from the two analyses were overlayed and areas which were not classified by both Raman and morphological analysis were labelled in blue. Despite some discrepancies at the edges of the bacterial clusters, the major clusters were correctly identified across all sample regions. This confirmed that Raman spectroscopy could effectively determine bacterial coverage in a dual-species biofilm.

Analysis of A. denticolens and S. oralis distribution in dual-species biofilms. Morphology analysis and Raman analysis were directly compared. Layover images show areas where species classification differed between morphology and Raman analysis (blue).
Conclusion
Confocal Raman spectroscopy presents a non-destructive, affordable method for studying biofilms. The chemical fingerprint generated with Raman provides information about biofilm composition and architecture. Subsequent multivariate analysis allows spectra to be effectively separated based on small differences. Thus, Raman spectroscopy could further enhance our understanding of oral disease progression.
Note
This is a summary of the piece Mapping of a Subgingival Dual-Species Biofilm Model Using Confocal Raman Microscopy, by Kriem Lukas Simon, Wright Kevin, Ccahuana-Vasquez Renzo Alberto, Rupp Steffen, published in Frontiers in Microbiology, 12, 2021, the original piece can be found by following this link: https://www.frontiersin.org/article/10.3389/fmicb.2021.729720
The topics covered in this article are interpretations and summaries made by Renishaw employees of the original article. They are meant as merely summaries and should not be taken as a true representation of the author's original work and the licensor does not endorse Renishaw PLC in any way.
The original article is copyright © 2021 Kriem, Wright, Ccahuana-Vasquez and Rupp. This is an open-access article distributed under the terms of the Creative Commons Attribution License (CC BY).The use, distribution or reproduction in other forums is permitted, provided the original author(s) and the copyright owner(s) are credited and that the original publication in this journal is cited, in accordance with accepted academic practice. No use, distribution or reproduction is permitted which does not comply with these terms.

Further reading
We have a whole range or articles, case studies and news stories about Raman spectroscopy.

About the inVia microscope
Discover more about how the inVia confocal microscope is suitable for your organisations applications.