Raman applications
You can perform both quantitative and qualitative molecular analysis with our Raman spectroscopy systems. They have an extensive range of applications, in many fields.
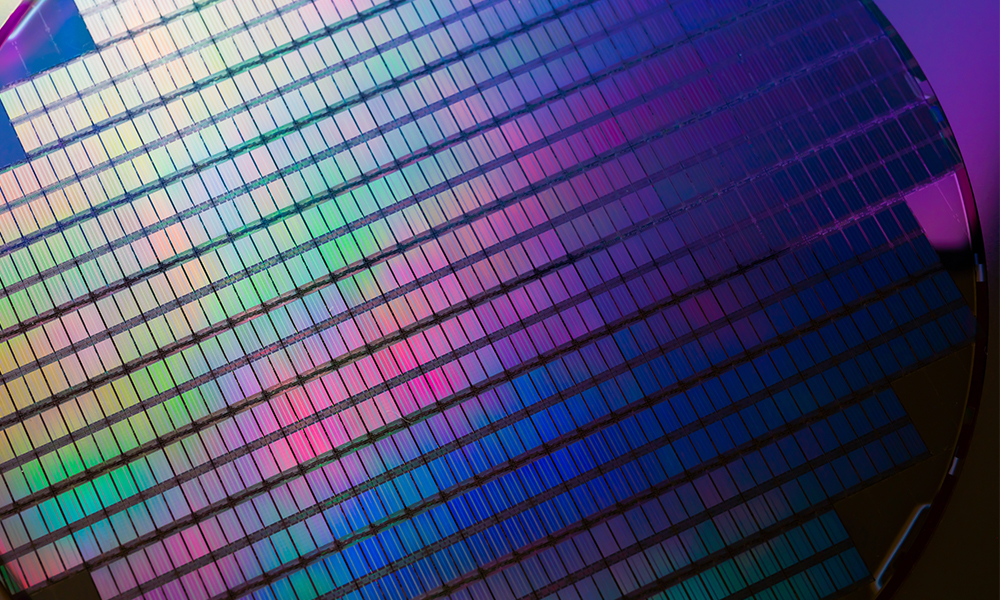
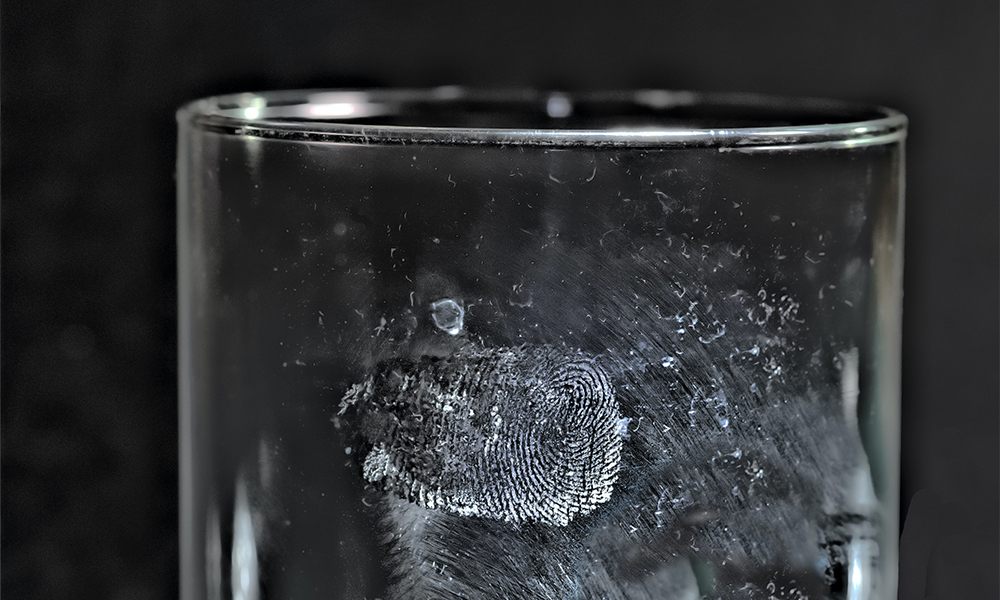
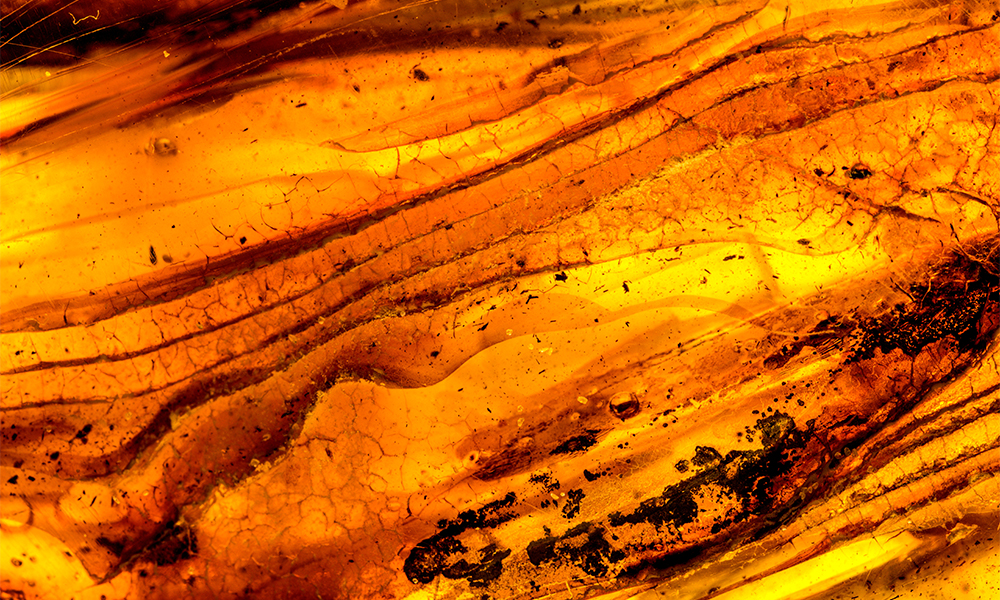
Our high-sensitivity spectrometers make it easy to chemically analyse solids, liquids and gases. They are an invaluable tool for material identification and verification.
Explore the many application areas listed below or contact us with your specific requirements.


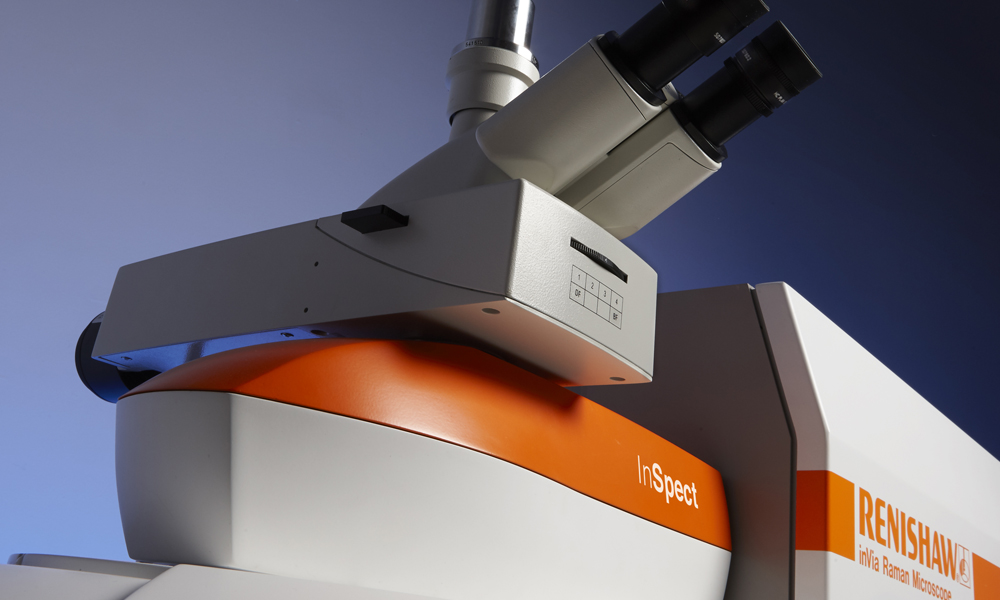
Our Raman products
Our Raman systems are used worldwide, in a diverse range of application areas. Discover which instrument suits your requirements.
Want to find out more?
Contact our applications team to find out more about Raman application areas or to discuss a specific project.