Navigation
Analysis charts
What do the MCG tools analysis charts represent?
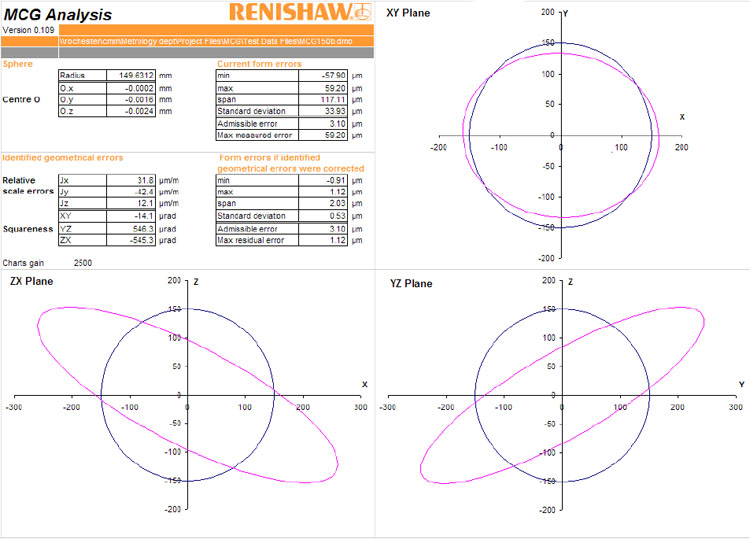
The page 'Analysis' presents a printer friendly version of the analysis results. The first part displays the analysed result along with three 2D plots. There is a plot for each principal plane of the machine: the XY plane, the YZ plane and the ZX plane. The effect of the identified CMM errors on the MCG arm length is plotted. The effect is magnified by a gain.
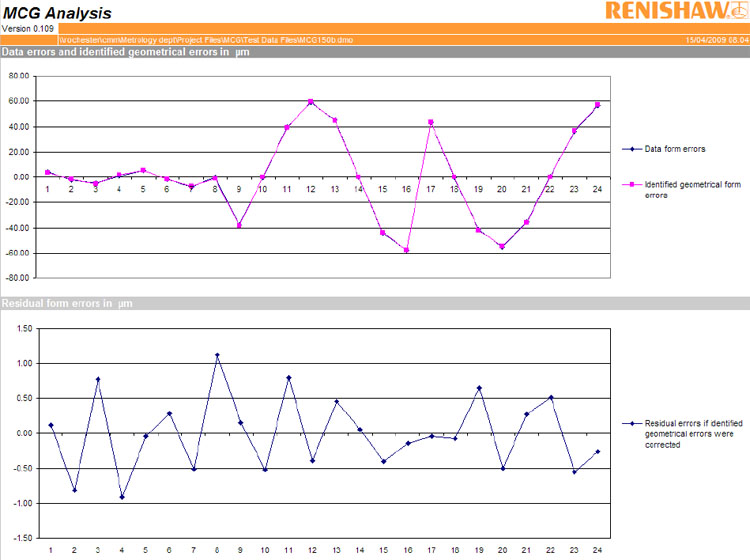
The second part presents the individual radial error of the data with the identified radial errors. Finally, the residual errors (that cannot be identified as squareness errors or as scale mismatch) are plotted.