Time-resolved Raman spectroscopy (TRRS)
Configure your inVia™ confocal Raman microscope with TRRS to overcome sample fluorescence and get clear Raman data.
Time-resolved Raman spectroscopy (TRRS) is a technique that leverages the faster interaction time of Raman scattering to distinguish the Raman-scattered photons from the fluorescence background. In this way, TRRS can help you to overcome the problem of fluorescence emission, which can be orders of magnitude more intense than the Raman signal. This cutting-edge technique enables you to measure high-quality Raman spectra from strongly fluorescent samples.
TRRS uses a pulsed laser and an ultra-fast detector to separate Raman-scattered light from fluorescence. You can use it to analyse samples that are impossible to measure with conventional Raman systems. Find out how you can perform TRRS using an inVia microscope. We discuss some incredibly difficult samples that cannot be measured on a conventional Raman system. These include highly fluorescent samples like chemicals, polymers, or pigments, and samples at extremely high temperatures exhibiting broad black-body emission.
How does time-resolved Raman spectroscopy work?
• By incorporating a dispersive element, i.e. a grating, we can measure the time taken for photons of varying energy, or wavenumber, to reach the detector.
• After many laser pulses, a histogram of arrival time versus wavenumber is generated. This histogram includes photons associated with Raman scattering and fluorescence.
• Raman scattering is a rapid process, typically occurring picoseconds after each laser pulse.
• Fluorescence, on the other hand, is an absorption and emission process influenced by the sample's electronic structure, making it slower than Raman scattering. Fluorescence emission typically occurs nanoseconds to milliseconds after each laser pulse.
• Understanding these timescales has enabled Renishaw to develop a proprietary algorithmic method to easily extract the Raman data from the histogram.
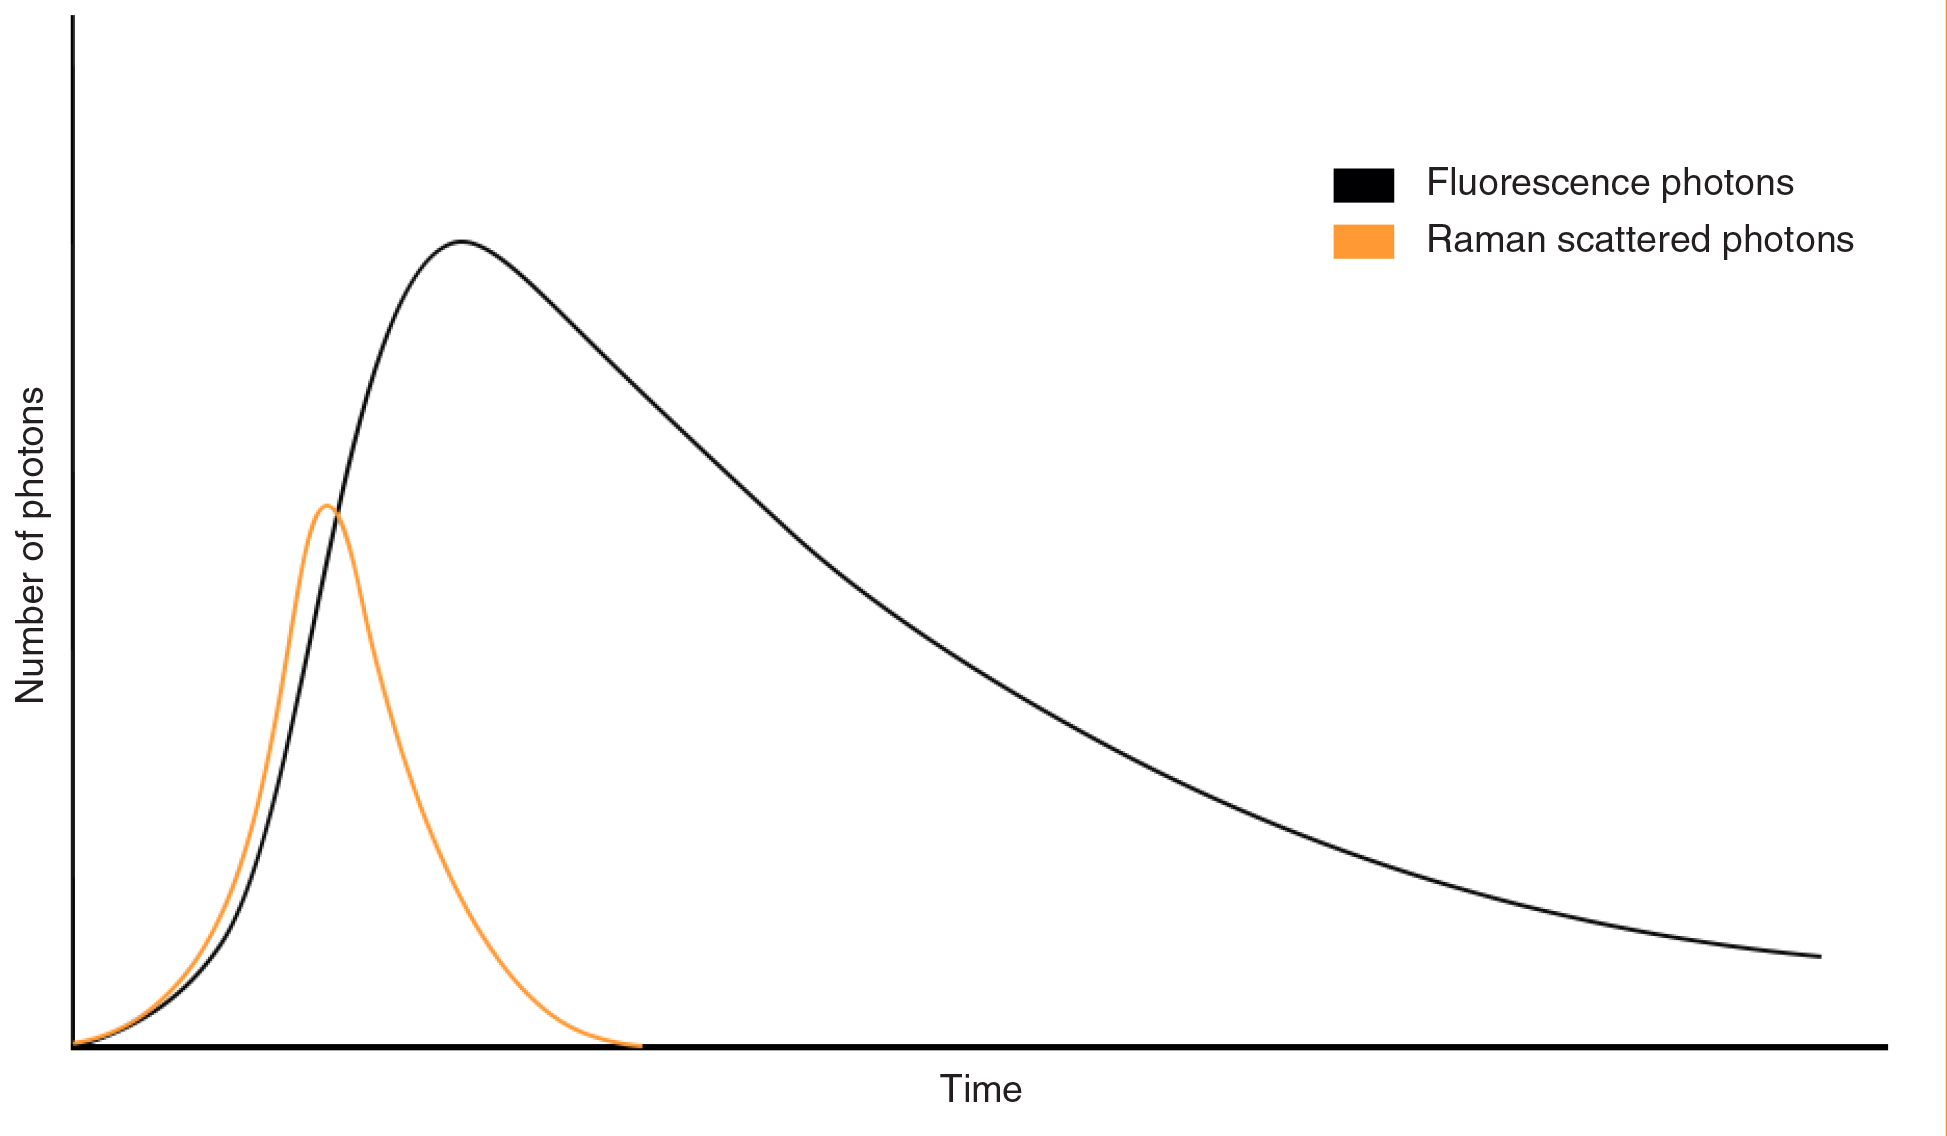
Photon arrival times for a hypothetical fluorescent sample exposed to a laser source at time = 0. Raman photons arrive almost immediately, whilst fluorescence photons arrive later and are spread over a longer time period.
Time-resolved Raman spectroscopy (TRRS) integration for inVia confocal Raman microscopes
The inVia microscope's TRRS system combines a high-repetition-rate picosecond pulsed 532 nm laser and a single-photon avalanche diode (SPAD) array detector. The SPAD array can detect single photons and record the time they arrive relative to the laser pulse. In the inVia spectrometer, a grating disperses the light along the axis of the SPAD array, allowing the observation of photon timing across different wavenumbers.
Data collection and analysis are fully managed by the WiRE software suite, enabling quick and easy data acquisition. The software uses time-correlated single-photon counting (TCSPC) to build a comprehensive emission profile from the sample, and a proprietary chemometric method to separate the Raman spectra from background fluorescence.
The inVia™ confocal Raman microscope is a modular research-grade Raman spectrometer, which can now be configured for time-resolved Raman spectroscopy (TRRS).
SPAD arrays are still an emerging technology, and the pixel-to-pixel response can vary, leading to unwanted spectral artefacts. To address this, engineers at Renishaw have developed a new measurement method based on our SynchroScan extended scanning technology. In this way, the rotation of the spectrometer grating is synchronised with the collection of spectral data at the detector. This patented technology prevents a single bad pixel from adding artefacts to an entire wavenumber region, thus giving you confidence in your TRRS data.
Renishaw has been developing TRRS systems for a decade. We have filed a number of patents to offer improved throughput, prevent spectral artefacts and extract TRRS data. Our advanced instrumentation and software make TRRS data consistent and reliable, while simplifying the extraction of the spectral data. We provide a unique TRRS solution to give you what you truly need: clear Raman spectra from your fluorescent samples.
Example 1: TRRS analysis of highly fluorescent samples
To demonstrate how TRRS can avoid sample fluorescence, and obtain clear Raman spectra, we analysed the following samples:
- Kapton®, a polyimide film commonly used in flexible electronics
- Sesame oil, which is a typical cooking oil
- Coloured and clear LEGO® bricks
Using the example of sesame oil, we discuss how our TRRS integration collects and processes spectral data. To read more about each highly fluorescent sample that we analysed using TRRS, download the product note here.
Raman spectroscopy is frequently employed to analyse lubricating and cooking oil samples and their additives. However, oil samples typically exhibit underlying broadband fluorescence, which is expected from their usual brown to black colouring. As a result, both lubricating and cooking oils are often difficult to measure with conventional Raman, and are an ideal sample for time-resolved Raman spectroscopy (TRRS).
WiRE software produces a histogram of the photon arrival time from sesame oil collected using TRRS, as shown below on the left. It illustrates that at shorter arrival times up to 300 ps, Raman photons dominate, and a Raman spectrum can easily be seen. After 300 ps, the fluorescence background begins to increase eventually becoming stronger than the Raman signal. At arrival times after 800 ps, there is no Raman contribution at all, only a strong fluorescence background. It is clear that if the data was summed over the entire time period it would be difficult to extract any Raman signal from the fluorescence background. Instead, we use a proprietary algorithm to extract the Raman data.

Histogram illustrating the timing profile of emission from sesame oil. The laser pulse occurs at time ~0 ps. Here, it can be seen that the sharp peaks from initial Raman scattering occur from ~300 ps to ~800 ps. The fluorescence background occurs from 400 ps with maximum intensity at ~600 ps, and continues to the end of the measurement period. Conventional Raman spectroscopy sums the data over this entire time period, so the fluorescence contribution would dominate the Raman data.
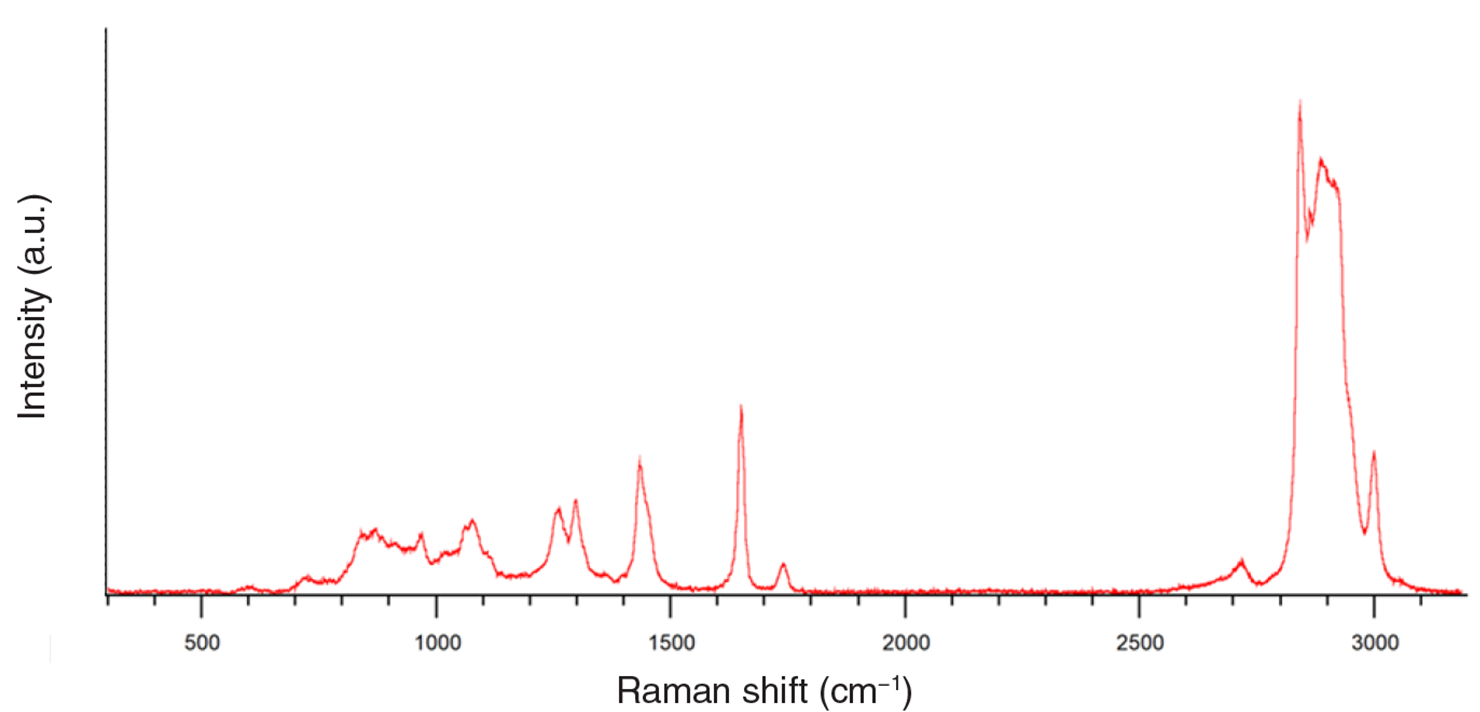 TRRS Raman spectrum from sesame oil. This spectrum was extracted from the histogram using Renishaw's proprietary method. This spectrum contains comprehensive Raman information and reveals weak bands at 500 cm−1 and 600 cm−1 that are close to the noise floor.
The corresponding Raman spectrum of sesame oil is shown above on the right. Here we used SynchroScan technology for the measurement, collecting all the Raman information between 300 cm−1 and 3100 cm−1. There are no artefacts, and we are able to resolve very weak convoluted bands between 500 cm−1 and 1000 cm−1.
Example 2: Reducing black-body emission during high temperature analysis with TRRS
Time-resolved Raman spectroscopy (TRRS) can easily obtain clear Raman spectra from high-temperature samples emitting a high level of black-body radiation. Typically, conventional Raman spectroscopy on hot samples is challenging due to the broad black-body emission that can completely overshadow the Raman spectrum.
In contrast, the TRRS integration on an inVia microscope can easily measure hot samples with high black-body radiation emission using visible laser excitation wavelengths. TRRS measurements extract Raman data collected from a short time period after the laser pulse. This significantly reduces the spectral background due to ambient light or black-body emission.
Using the TRRS integration on an inVia microscope, we collected clear Raman spectra from a sapphire sample heated between room temperature and 1500 °C. In the figure below, we can easily resolve all the Raman bands of sapphire, including the weaker modes, even at the highest temperatures.

A heating stage was used to heat a sapphire sample to 1500 °C during in-situ Raman analysis.
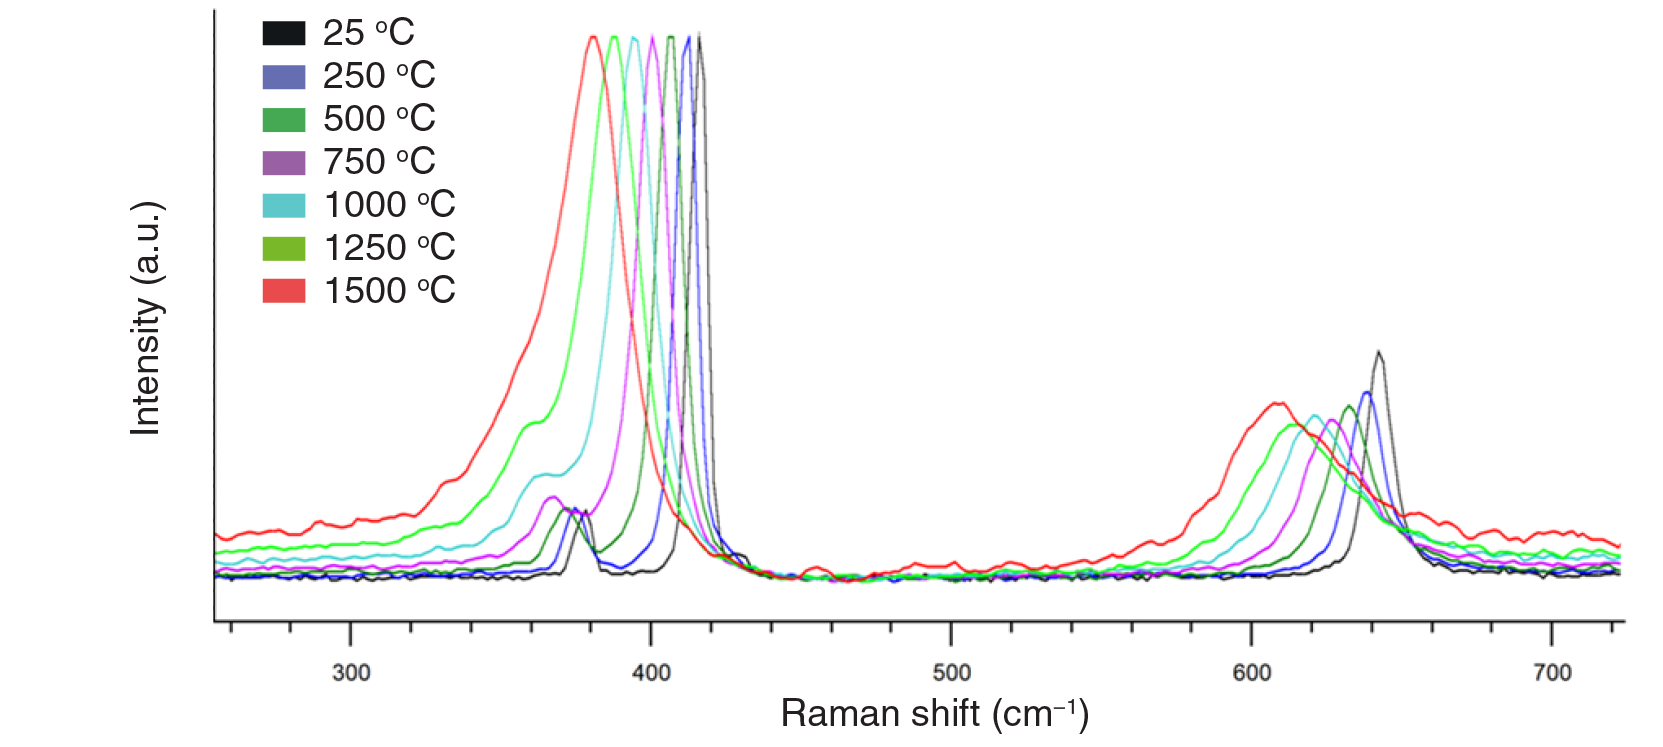
Raman spectra of sapphire acquired using TRRS at increasing temperatures. TRRS eliminates the contribution of black-body emissions. This enables accurate measurements of the sapphire Raman bands and makes it easy to calculate the photon temperature dependence.
Watch our webinar on time-resolved Raman spectroscopy
Want to find out more?
Your local representative will be happy to help with your enquiry.
You can contact them by completing a form or sending an email.
Downloads