Financial information
Growth figures and historic performance in key areas
10-year financial record
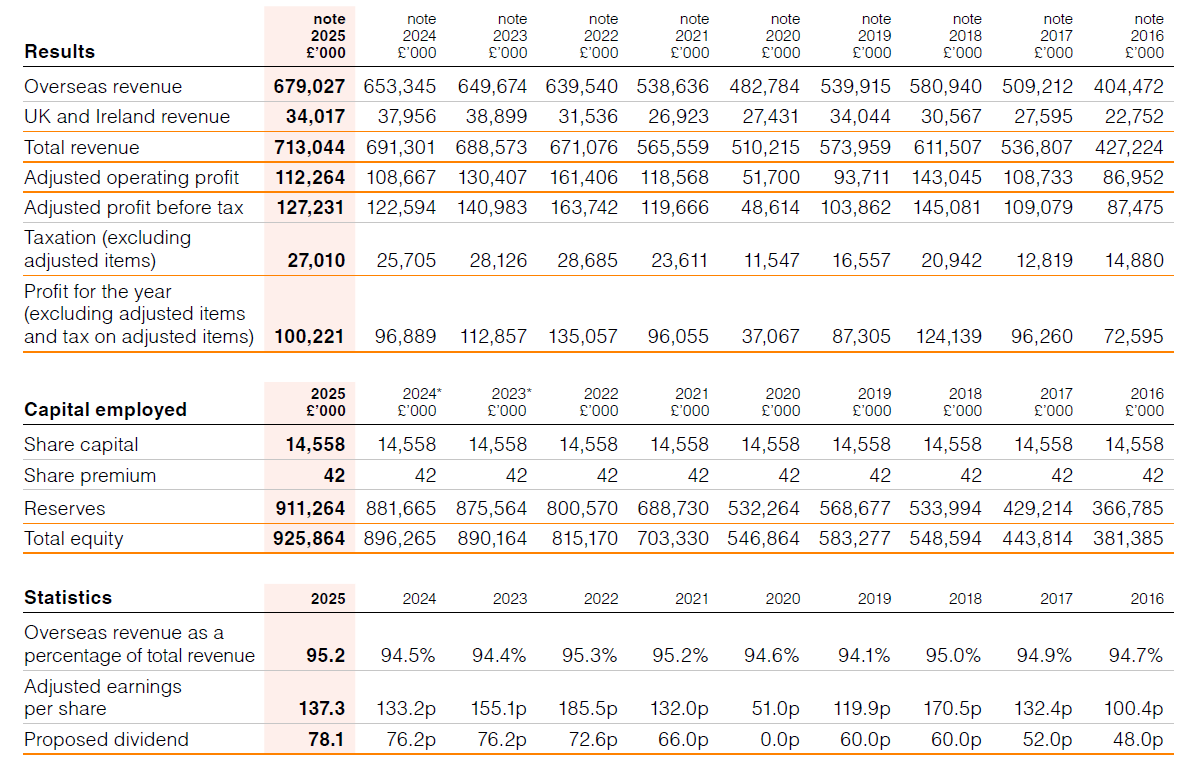
*Reserves and Total equity has been restated in the comparative information for 2024 and 2023. See note 1 for further details.
Note
The results and adjusted earnings per share for the years 2016, 2017, 2018, 2019, 2020, 2021, 2022 and 2023 exclude certain items. These were:
− 2016 (£25.8m pre tax loss), 2017 (£8.0m pre tax gain), 2018 (£10.1m pre tax gain), 2019 (£6.1m pre tax gain), 2020 (£21.6m pre tax loss), 2021 (£23.0m pre tax gain) and 2022 (£8.3m pre-tax loss) and 2023 (£5.5m pre-tax gain) gains and losses from financial instruments not effective for cash flow hedging;
No years prior to 2016 have been adjusted for gains and/or losses from financial instruments not effective for cash flow hedging.
− 2020 (£23.8m loss), 2022 (£1.7m gain) and 2023 (£0.7m) restructuring costs;
− 2021 (£3.2m loss) and 2022 (£0.2m gain) third-party FSP costs;
− 2022 (£11.7m loss) UK defined benefit pension scheme past service cost;
− 2023 (£2.1m loss) US defined benefit pension scheme past service cost.