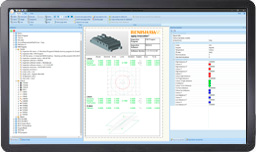
Reporting and analysis
The standard MODUS Reporter provides traditional reports, whilst the standalone MODUS CHART application delivers full-colour pictorial inspection reports using the CAD model or representation of the component. Inspection results can also be output in a range of formats for further analysis.
MODUS™ CHART
A standalone application for MODUS metrology software with enhanced graphical reporting
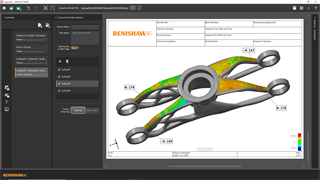
The MODUS CHART software package simplifies report interpretation by displaying graphical information on the true location on the part using QIF XML files and the part CAD model.
The enhanced reporting functionality includes:
- On-CAD plots with flexible callout positioning and configuration.
- Surface heatmap colouring and automatically generated feature tables for the display of all feature tolerances.
- Errors-only reporting option that allows for the quick creation of reports which only include features that are out of tolerance, reducing report size and focusing on the results which are most important.
- Two different methods for creating reports. Feature-based reporting groups tolerances together and characteristic-based reporting displays each individual tolerance separately.
- Automatic reporting option that creates reports quickly and easily. This includes Errors only for focusing on the most important results.
Help and training
The MODUS CHART installation package provides sample data within the Program Data folders.
Software compatibility
MODUS CHART requires QIF files to produce reports. MODUS 1.11 (and onwards) is required to produce QIF files.
Hardware compatibility
MODUS CHART licence is available free of charge as an add-on to a MODUS 1.x licence.
Standalone versions of MODUS CHART can be purchased. Contact your local Renishaw supplier for details.
MODUS™ Reporter features
Clear, concise graphical reporting
With fully user-configurable header, labels, text and images.
Multi-part inspection
A single report can provide a complete history of a series of components, including results tables and statistics.
Fast report creation
New reports can quickly be created from scratch or based on existing layouts, using wizards that provide assistance with page layouts.
Flexible exchange of inspection data
Results data can be output for use with 3rd party applications in a range of formats including Excel (CSV), ASCII text, DMIS, XML based QIF or directly to the Microsoft® SQL database.
Statistical analysis
Users of the leading Q-DAS SPC package are fully supported with a simple, user-configurable operator's interface from which type 1 and 2 studies can be launched.
Data evaluation and analysis
MODUS metrology software through our PARead function can read in data from different sources to evaluate and analyse data and report results. Fitting and filtering evaluation techniques with PTB certified fitting methods and ISO compliant filtering standards can also be used.
MODUS software uses ISO and ASME evaluation standards to comply with worldwide industry needs making the most of software features such as point cloud analysis, plane, cylinder and 3D curve slicing to get the most out of your inspection data.