Images of glioma cells (jpg)
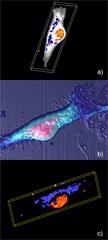
a) section from a 3D Raman volume map of a glioma cell. It shows the distribution of the organelles: white/grey (cell body); yellow/orange (nucleus); blue (lipid droplets / membrane-bound organelles). Renishaw thanks Dr Matthew Baker, University of Central Lancashire, UK, for providing the cell sample. b) AFM topographof a glioma cell. The round raised nucleus is shown in red. c) Raman volume image, showing the nucleus (red) and lipid droplets / membrane-bound organelles, such as Golgi apparatus, endoplasmic reticulum and mitochondria (blue). Renishaw thanks Dr Alex Berquand, Bruker Nano GmbH, Germany, for collecting and processing the AFM data; Dr Matthew Baker, University of Central Lancashire, UK, for providing the cell sample.
Other versions
Latest videos - Raman spectroscopy


Didn't find what you were looking for?
Tell us what you couldn’t find and we will do our best to help.