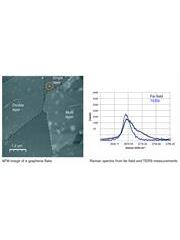
AFM image of a graphene flake with Raman spectra from far-field and TERS measurements (jpg)
File size: 4 kB
Language: English
Dimensions: 180 x 90 px
The circle represents the size of the laser spot, from which a far-field Raman spectrum was acquired (black). The smaller dot represents the location of the TERS hot-spot on the graphene (~ 20 nm diameter), from which a TERS spectrum was derived (blue). The carbon 2D band of the far-field spectrum (black) exhibits features of single-, double-, and multi-layer graphene. The band in the TERS spectrum (blue) is narrower than that of the far-field spectrum, and represents solely single-layer graphene. This demonstrates the high spatial resolution of TERS.
Didn't find what you were looking for?
Tell us what you couldn’t find and we will do our best to help.
